
 |
 |
 |
| Introduction | |
| Key Features of EMFACT | |
| Intro to the Dashboard | |
| Toolbar & Menus | |
| Cue Cards | |
| Types of Users | |
| Types of Windows | |
| Summary | |
| Searching | |
| Getting Help in EMFACT | |
| Administration | |
| Introduction to the Dashboard | |
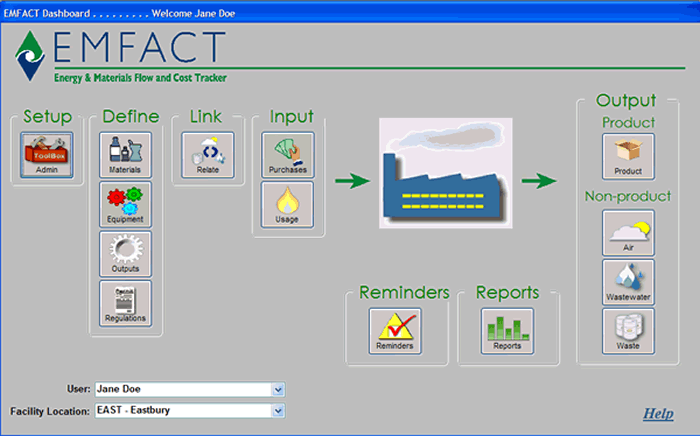
The EMFACT Dashboard is the program's “home page” and the starting point for any type of EMFACT work. The first thing to understand is that the EMFACT Dashboard is designed to emulate the flow of materials through a facility (from left to right)…that is, movement of a material from the point of purchase…to where it is used…to the products it ends up on...and to where pollutants (like VOCs) are emitted. Organization of the Dashboard reflects the EMFACT process. Each step must be performed in a certain order - much like a relay race, where runners can only perform their leg of the race when the previous runner finishes their part. Click on each section of the Dashboard below for a description. |
|
|
|

